
First Coined In 2011 Visualized Data trend icon

Visualized Data

To make sense of a real-time stream of information, more event managers, news organizations, and brands turn to visualization to leverage data, better understand it, and tell a clearer story.

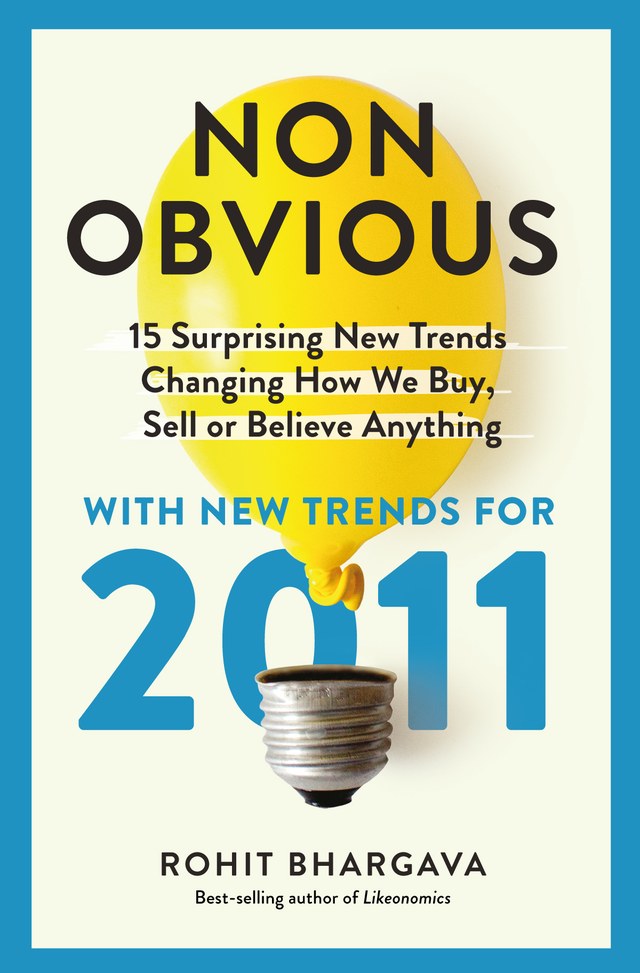
The 2011 Non-Obvious Trend Report, where Visualized Data was first coined

First published in the 2011 Non-Obvious Trend Report →

Trend Longevity Rating

B Graded B in 2026 ·
a strong prediction that largely held up

How this trend held up

The widespread overuse of infographics has created more skepticism of visualization, but better user interfaces, gamified design, and narrative storytelling continue to stand out and attract attention.

Every past trend prediction is re-reviewed and graded with a Trend Longevity Rating, measuring how much each originally curated trend still matters years later.

Keep Exploring

Part of the non-obvious
trend collection.

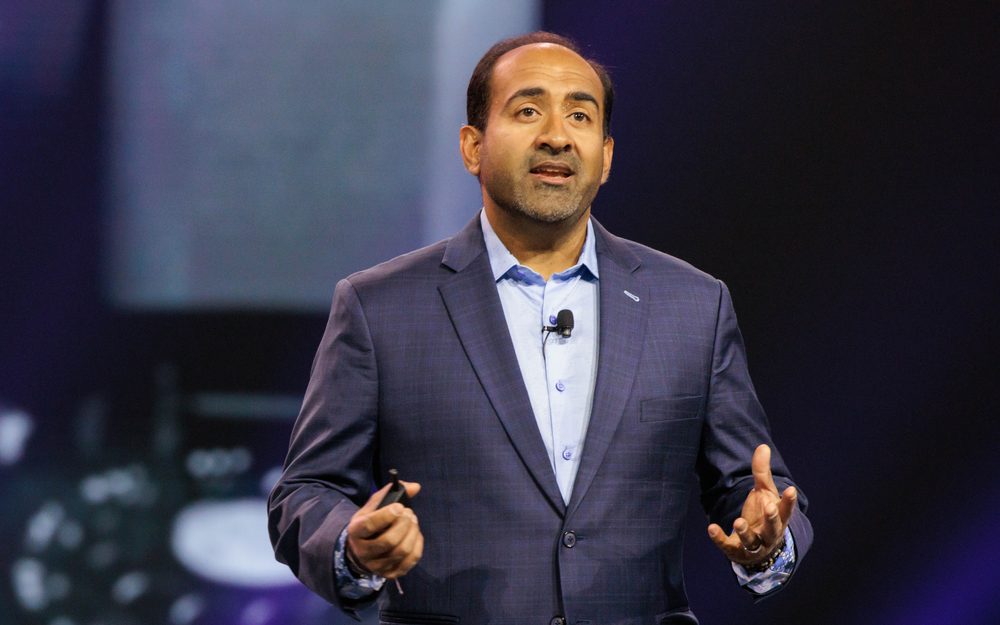
Rohit Bhargava delivering a keynote

Want To Use These Trends?

Book A Trend Keynote Or Workshop!

Bring this trend and more to your group with a customized keynote presentation or workshop session with Rohit Bhargava. Non-Obvious Thinkers win the future. Let’s explore how we can help you do this for yourself.

Learn More & Check Availability

Want More Non-Obvious Ideas?

Join 25K+ ReadersTo Get Weekly Insights

The Non-Obvious Insights Newsletter brings you the five or six most fascinating and overlooked stories of the week, with a quick take on why each one matters.

    One email every Thursday. No spam, unsubscribe anytime.